For the past month, I’ve been obsessing over color theory.
Old paradigm: When I use traditional paints to make greeting card art, the original image gets scanned. Then, I try to correct colors in PhotoShop, do layout in Illustrator, and print onto cardstock using a color laser printer. The colors never match exactly. It’s best to think of the cards as interpretations or derivative works.
New paradigm: Think of the laser printer as a painting robot, with built-in brushes and tubes of paint. Instead of trying to get accurate reproductions, approach the printer itself as my primary art-making tool.
Most folks learned in school how Red+Yellow=Orange, Yellow+Blue=Green, and Blue+Red=Purple. But the laser printer uses a completely different color system. The ways that Cyan, Magenta, Yellow, and Black interact with each other are much less intuitive.
Expert artists who use oil paints or watercolors often make their own color charts. After all, paints are chemistry: Cadmium, Cobalt, Phthalo, Zinc! Instead of expecting a platonic rainbow, we need to see what specific colors are available in reality.
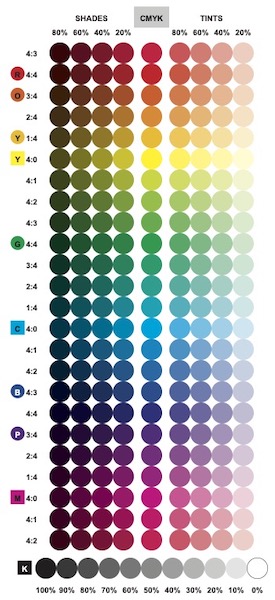
The same principle applies for toner cartridges. Who’s to say that Hewlett-Packard and Xerox use the same formulas for Cyan? So last fall I created my first “digital paintbox.” The main idea is that when I want to select a color, I should first look at the physical reference chart, rather than trusting what I might see on a computer screen.
(click for PDF)
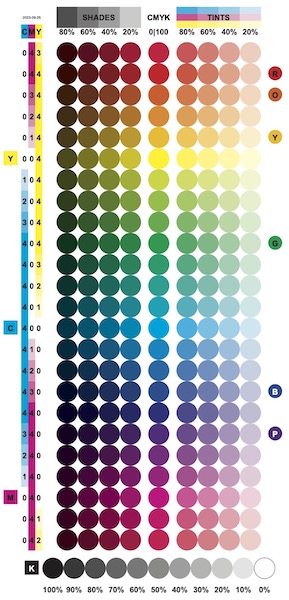
A small, lingering dissatisfaction with the original chart has has stuck with me. The past month’s color odyssey began with a decision to revise its labels.
The column of numbers on the left describes color-mixing in terms of proportions. The numbers 2:4:0 should be translated as 50% Cyan + 100% Magenta + 0% Yellow — which combine to make a nice purple. To help clarify these relationships, I added vertical bars of monochromatic color beneath the three-digit codes.
This step prompted me to similarly clarify labels at the top of the chart. A “shade” adds some amount of black to the color mix. A “tint,” on the other hand, decreases the amount of toner used, thus allowing more paper to show through. For example, a 40% tint of our 2:4:0 purple translates as 20% Cyan + 40% Magenta + 0% Yellow — a pleasant lavender. I feel these concepts become much more intuitive when the labels “SHADES” and “TINTS” are printed directly over representative shades of Black (left) and tints of CMY (right).
Something important was still missing from my revised chart: browns.
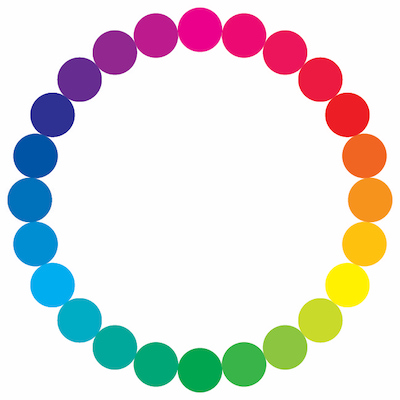
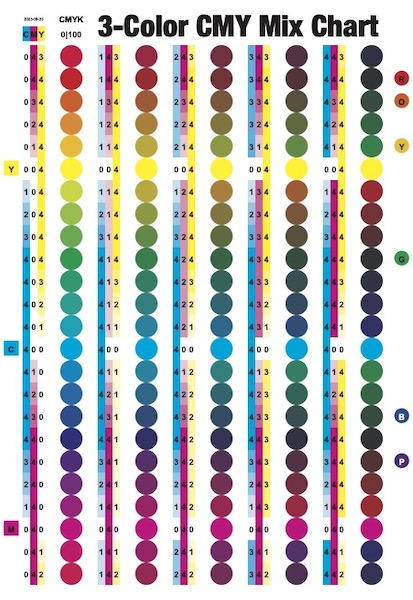
The 227-Swatch CMYK Chart is fundamentally based on a circular color sequence, illustrated by the “Rainbow Bead Bracelet” up top. If you look carefully, you’ll realize that none of the swatches combine Cyan, Magenta, and Yellow all at the same time. The three “primaries” only appear in their pure form (e.g. 0:4:0), or mixed with one adjacent color (e.g. 1:4:0 or 0:4:1).
My improved labeling system helped me finally see how to explore browns. Both the “Bracelet” and the middle column of the “digital paintbox” show 24 color swatches that have 0% Black and a maximum density of toner (100% tint). If you look at their CMY ratios (numbers on the left), notice that there’s always at least one zero in the three-digit code. In a new file, I made four copies of these 24 swatches, then systematically replaced zeros with 1s, 2s, 3s, and 4s. Assuming we confine toner increments of 0%, 25%, 50%, 75%, and 100%, my results now demonstrate all possible CMY combinations.
When I set out to explore browns, I recalled from RGB color theory that you usually start with Red+Yellow, then add a bit of Blue to muddy things up. The new “3-Color CMY Mix Chart” achieves this — but also reveals a lot more than just brown. I see some delicious wine reds, pine greens, and murky oceanic blues in there, too.
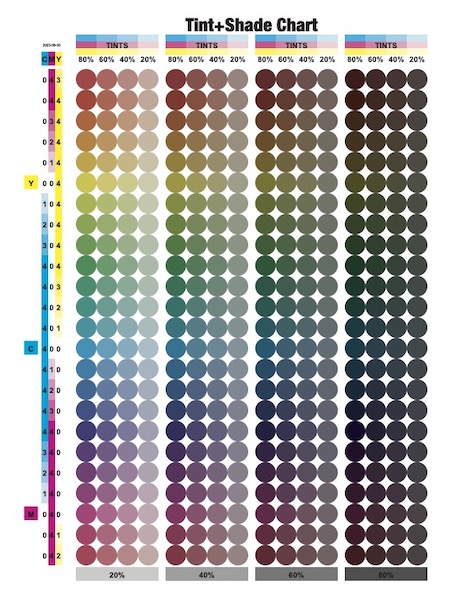
In RGB, another way to create brown is to start with Red+Yellow, then add a bit of Black. This got me to thinking. Some of the Black-shaded reds, oranges, and yellows in my original “paintbox” could probably serve as browns. But what if I started with just the four CMY “tint” columns and then sequentially added 20%, 40%, and 80%-Black to each of them?
This experiment resulted in the chart immediately above. What I notice is that adding Black creates colors which are more dingy. Before, when I was only mixing C+M+Y, colors were richer.
Also, I was surprised by how many of these swatches basically look gray to me. I guess I tend to think of “grays” as an entirely desaturated color set… But really, there’s a huge world of gently-tinted grays that you could choose to work with.
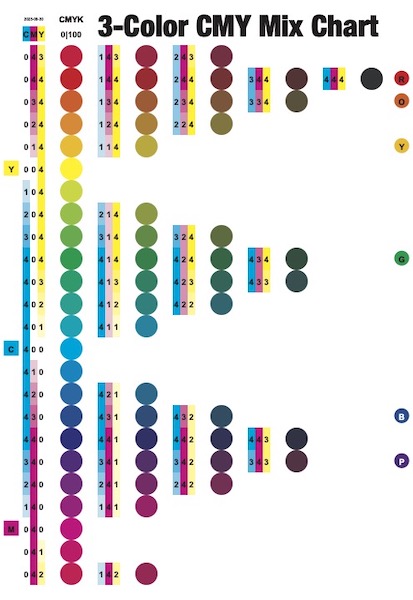
While building the “Tint+Shade Chart,” I kept glancing over at the freshly completed “3-Color CMY Mix Chart.” Slowly it dawned on me: my clever document was chock-full of duplicate values.
Embarrassing.
I spent a while going over the chart again, deleting all the repeated swatches. What emerged is a collection of dots clustered into three triangular groups. I had a hunch…
I wondered if a hexagonal logic might be at work?
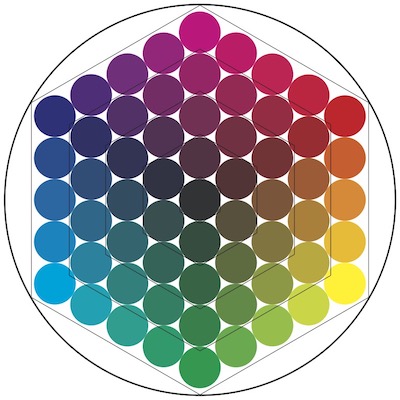
I tried reorganizing the dots again. Sure enough, they fit neatly inside a series of concentric hexagons. And all the relationships implied by mixing adjacent colors have been appropriately preserved.
Could I perhaps get rid of the dots entirely? Transition instead to a grid comprised wholly of hexagons?
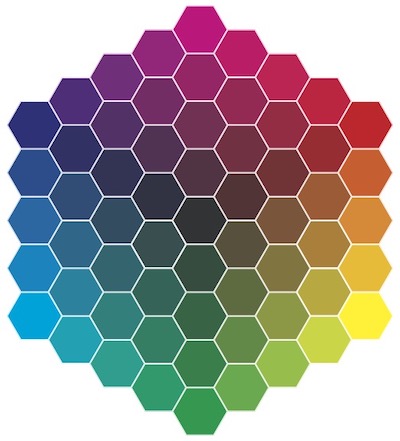
YES. This iteration started off mainly as an aesthetic curiosity. But as I continued exploring CYMK color theory, from here on forward, the “honeycomb” image became ever more useful.